Polar vortex 2026: a record-early collapse is forecast. What 31 past ones did to US weather
Models forecast the earliest polar vortex reversal on record, around Nov 5. We checked NASA and NOAA data back to 1979: what it means for US cold, and what it doesn't.
By Tom Calder · Updated October 31, 2026 · Our analysis of NASA MERRA-2 wind data, NOAA's Sudden Stratospheric Warming Compendium and NOAA nClimGrid-daily temperatures, with NOAA Climate Prediction Center outlooks
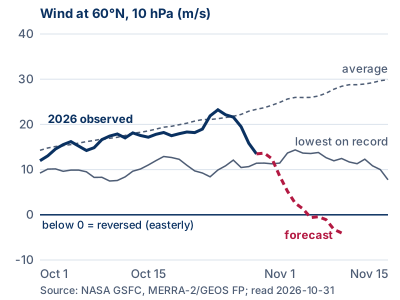
- Forecast, not yet observed: NASA's forecast in its daily polar vortex file, read October 31, has the winds 19 miles up at 60°N reversing on November 5. On October 29, the last measured day, they were still blowing west to east at 30 mph.
- If it happens, it would be the earliest major sudden stratospheric warming in NOAA's records back to 1958, about three weeks ahead of the old mark of November 27 to 29, 1968.
- Our check of 31 past events since 1979: in the 30 days after, the lower 48 was colder than normal 18 times, about what you'd expect by chance. The second month leaned colder, most clearly in the West and Northwest.
- NOAA's official outlooks, issued October 30, still favor a warmer-than-normal northern US through November 27, with equal odds in the Southeast and Southern Plains for November 14 to 27. This is not our forecast.
What is forecast, and how sure it is
The polar vortex is a ring of strong west-to-east winds high over the Arctic in winter. Scientists track it with one number: the average wind around the 60°N latitude line at 10 hPa, about 19 miles up. NASA publishes that number daily. When it turns negative, meaning the wind reverses to east-to-west, that marks the start of a major sudden stratospheric warming, as long as the winds later recover.
Observed: on October 24 the wind was 23.2 m/s (52 mph), a little above the average for the date. By October 29, the last day of measured data in NASA's file, it had dropped to 13.5 m/s (30 mph), against an average of 23.3 m/s and a record low for that date of 11.4 m/s.
Forecast: in the same file, read at 12:20 UTC on October 31, NASA's GEOS FP forecast drops below the lowest value in NASA's record since 1979 for each date from November 1, reaches -0.6 m/s on November 5 and -4.0 m/s (east-to-west at 9 mph) on November 9, where the forecast ends.
Other models agree on a sharp drop, with less certainty about a full reversal. Severe Weather Europe reported on October 28 and 29 that the ECMWF ensemble put the odds of a reversal at 96%, against 71% for NOAA's GEFS and 37% for ECMWF's AI model. NOAA's Climate Prediction Center charts of the American GFS and GEFS, updated October 31, show most runs falling to about zero in the first half of November, with a few GEFS members strengthening instead.
How rare: the earliest on record
NOAA's Sudden Stratospheric Warming Compendium lists every major warming from 1958 to 2023 in six global datasets. The earliest in the season is November 1968: November 27 in one dataset, November 28 in two and November 29 in another. A November 30, 1958 event shows up in only one of the four datasets that cover 1958. Since 1979, the earliest is December 4, 1981, found in all six.
A reversal on November 5 would beat the 1968 record by 22 to 24 days and the 1981 mark by 29 days. Severe Weather Europe's "at least three weeks" matches our count.
We also ran the standard test ourselves on NASA's daily MERRA-2 record. It found 25 of the compendium's 27 MERRA-2 dates on the same day. Of the other two, one is a day apart because NASA's file has no February 29, and in the other the wind bottoms out just above zero. It also flagged three dates the compendium's MERRA-2 list doesn't have, two of them one-day dips to just below zero. Since the compendium's last update in 2023, the same test finds three more events: January 16, 2024, March 4, 2024 and March 4, 2026.
The closest November miss came just last year. On November 28, 2025 the wind fell to 0.27 m/s (0.6 mph) and then strengthened again, so it never reversed. The next closest was November 21, 1996, at 1.8 m/s.
What happened in the US after past events
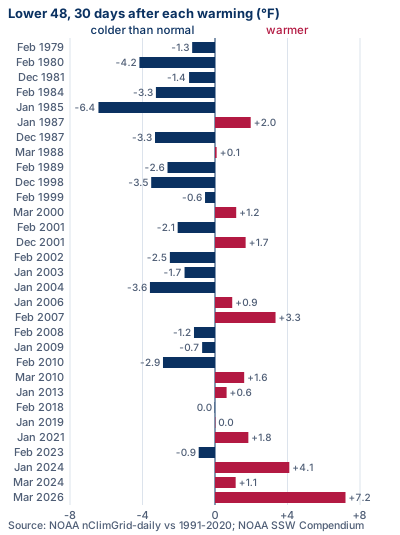
This is the question that matters at home, so we measured it. For each of the 31 major warmings from February 1979 to March 2026, we averaged NOAA's daily temperature for the lower 48 over the 30 days after the reversal and compared it with the 1991 to 2020 normal for those days.
Result: the lower 48 was colder than normal after 18 of the 31 events (one by just 0.02°F) and warmer after 13. The average across all 31 was 0.5°F below normal. But in the 1980/81 to 2025/26 winters, any 30-day stretch starting between November 1 and March 31 came out colder than normal 52% of the time. That means about 16 cold months out of 31 would happen with no warming at all. Eighteen is not a meaningful difference.
The second month is different. In days 31 to 60 after the reversal, the lower 48 was colder than normal after 21 of 31 events, 0.9°F below normal on average. That is more than chance would suggest, but not by enough to be sure. With 31 events and many ways to slice them, it is a lean, not a rule.
The spread is wide. January 1985 was 6.4°F below normal for the following month. After the January 2024 event, the lower 48 was 4.1°F above normal, and after March 2026 it was 7.2°F above.
Which regions turned colder
We ran the same test for NOAA's nine US climate regions. In the first 30 days, no region stands out: each was colder than normal after 16 to 20 of the 31 events, close to the 15 to 17 that chance alone would give. The Southeast was the most often colder, 20 times.
In the second month, two regions stand out. The Northwest (Washington, Oregon, Idaho) and the West (California, Nevada) were each colder than normal after 24 of 31 events, against about 16 expected. The South (Texas, Oklahoma, Kansas, Arkansas, Louisiana, Mississippi) and the Southwest (Arizona, Colorado, New Mexico, Utah) were colder after 21, and the Northern Rockies and Plains (Montana, Wyoming, the Dakotas, Nebraska) after 18. The Northeast was colder after 15, the Ohio Valley after 16, and the Upper Midwest and the Southeast after 17 each, all close to a coin toss.
The western result is the strongest pattern in our data, but we tested nine regions over two time windows. Treat it as a lead to watch, not a forecast. It also runs against NOAA's own outlook for late November, which favors warmth along the West Coast.
Texas in February 2021: what the data shows
The February 2021 freeze is often linked to the polar vortex. The warming began on January 5, 2021. In the 30 days after it, the lower 48 was actually 1.8°F warmer than normal. The cold came later: In NOAA's daily data, the South region's coldest day in the two months after the reversal was February 16, 2021, 37.9°F below normal, 42 days after it began.
That fits the second-month pattern above, but timing alone doesn't prove the warming caused the freeze. The same goes for January 1985, the coldest first month after any event in our list. Weather in a given week has many causes. What the record shows is that cold, when it follows, can arrive weeks after the headlines.
Why November is uncharted
Only two major warmings in NOAA's compendium happened in November: 1958, found in one dataset, and 1968, found in all four that go back that far. Both came in El Niño winters. In the 30 days after each, the lower 48 was colder than normal, by 2.4°F in 1958 and 3.9°F in 1968. Two cases can't show a pattern.
The 31 events in our US analysis all happened between December and March, most of them in January and February. The jet stream, snow cover and the amount of cold air in the Arctic are all different in early November. So past events tell us little about this one, and we wouldn't trust anyone who says they know how it will play out.
What NOAA's official outlooks say
The Climate Prediction Center's 6 to 10 and 8 to 14 day outlooks, issued October 30, favor above-normal temperatures across almost all of the lower 48 from November 5 to 13. The odds are above 70% from the Northern Plains into the northwestern Great Lakes, and near-normal temperatures are favored in the southeastern US in the second week. The discussion doesn't mention the stratosphere.
Its week 3 to 4 outlook, issued the same day for November 14 to 27, does. It says "a rare November stratospheric polar vortex disruption is unfolding," with a major sudden stratospheric warming forecast "in a week," and that the effects "often persist for up to two months." It adds: "Recent forecast guidance reflects a shift toward a negative AO." That is the Arctic Oscillation pattern that often follows a warming. Even so, it favors above-normal temperatures along the West Coast and across the northern US, and gives equal chances of above, near or below normal in the Southeast and Southern Plains.
The November outlook from October 15 also favors warmth across the northern two-thirds of the country. NOAA was due to update it on October 31. We will check it and the next week 3 to 4 outlook, due November 6.
Is this because of El Niño?
A strong El Niño is under way. The Climate Prediction Center put weekly sea surface temperatures in the key Niño 3.4 region about 2.5°C (4.5°F) above normal on October 30. Its winter outlook, issued October 15, said the polar vortex is typically stronger and more stable under El Niño and the westerly phase of the QBO, a wind pattern high over the tropics, both expected this winter. It said a more stable vortex "slightly decreases the odds" of sudden warmings. A November reversal would run against that.
NOAA's records show El Niño winters are no protection. Using the compendium's ERA5 list from 1958 to 2023 and the Climate Prediction Center's index, we count 16 major warmings in 23 El Niño winters and 16 in 23 La Niña winters, but only 10 in 20 neutral winters. Eight of those 16 El Niño events came with a westerly QBO, the same mix as this winter. So El Niño doesn't explain this event, and it doesn't rule one out either.
What is the polar vortex?
The National Weather Service describes it as "a large area of low pressure and cold air surrounding both of the Earth's poles." It always exists, and it strengthens in winter. The one in this week's news is the stratospheric polar vortex, the ring of winds about 19 miles up that NASA and NOAA track. It is linked to the cold air near the ground but is not the same thing.
NOAA's Climate.gov explains that when the wind at 60°N and 10 hPa reverses, "it's called a sudden stratospheric warming," because the air over the pole warms sharply. The vortex then usually either moves off the pole or splits into two smaller vortices. Severe Weather Europe expects a split this time. "Collapse" is a headline word, not a scientific one. It usually means the reversal.
Who is saying what, and what's off
Some headlines have gone further than the data. The Daily Mail ran "Polar vortex collapse coming within days as bitter cold set for US" on October 28. The Mirror US ran "Record-breaking polar vortex to bring bitter cold to parts of US next month" on October 29. The record part is fair if the reversal happens. The bitter cold is not in NOAA's outlooks, which favor warmth across the northern US through November 27.
Headlines such as Newsweek's "Super El Niño, Polar Vortex Collapse Could Hit US At Same Time" and The Boston Globe's "The polar vortex shows signs of a rare early weakening" frame it as a possibility, which fits the data. An AccuWeather headline, also carried by Yahoo, "No frigid air coming to US in November despite polar vortex being on the move," matches NOAA's outlooks so far.
As of the last measured day, October 29, the wind had not reversed. It was still blowing west to east at 30 mph. Anything that says the collapse has already happened is ahead of the data.
What to do where you live
Nothing about this calls for buying in a rush. NOAA's outlooks favor mild weather across much of the country through November 27, which makes this a good time to check your heat before you need it.
Northern states, from New England to the Plains: NOAA favors above-normal temperatures through November 27. Use the mild spell to have your furnace or boiler inspected and to test your carbon monoxide alarms. Our winterize your home checklist covers the rest.
Texas, the Southern Plains and the Southeast: NOAA gives equal odds here for late November, and 2021 showed how badly a deep freeze can hit homes built for heat. Learn how to protect your pipes from our frozen pipes guide, and plan how you'd stay warm without power. The utility outage maps show who is out in your area.
The West and Northwest: our second-month signal is a lead, not a forecast. If you drive mountain passes, keep a winter car kit in the trunk from now on. Everywhere, follow your local forecast from the National Weather Service and our live winter storm tracker.
Heat safely if a cold snap or outage comes
These are the official rules from the Consumer Product Safety Commission (CPSC), Ready.gov and CDC. Our guides to space heater safety, generator safety and carbon monoxide go further.
- Space heaters: keep at least three feet from drapes, furniture and bedding, plug straight into a wall outlet and never an extension cord or power strip, and turn off when sleeping (CPSC)
- Carbon monoxide alarms: on every level and outside sleeping areas, battery-powered or with battery backup, tested every month (CPSC)
- Generators: outdoors only, at least 20 feet from the home with the exhaust pointed away, never in a home, basement, shed or garage (CPSC)
- Never heat your home with a gas stove or oven: it raises your risk of carbon monoxide poisoning (Ready.gov)
- Have heating systems and other gas, oil or coal appliances serviced by a qualified technician every year (CDC)
How we did this
Wind: NASA Goddard's daily 60°N, 10 hPa zonal-mean wind from MERRA-2, with GEOS FP for recent months and the forecast. Event test: the definition of Charlton and Polvani (2007) used by NOAA's compendium. A major warming starts on the first day from November to March that the daily wind turns easterly. A second event needs 20 westerly days in a row first, and a reversal only counts if westerly winds return for 10 days in a row before April 30.
Temperature: NOAA nClimGrid-daily averages for the lower 48 and NOAA's nine climate regions. Normal: the 1991 to 2020 average for each day, smoothed over 31 days. For each event we averaged days 1 to 30 and days 31 to 60 after the reversal. The test against chance: how often any 30-day window starting November 1 to March 31 in the 1980/81 to 2025/26 winters was colder than normal. We repeated the first-30-day test with the warming trend removed, and the lower 48 count stayed close to chance, at 17 of 31 against about 15 expected. The second-month test was not detrended.
Limits: 31 events is a small sample, the regions overlap in time and space, and a strong El Niño can swamp everything else. The script is scripts/polar-vortex-analysis.mjs and its output is data/polar-vortex-2026.json in our site's code, so anyone can rerun it.
Watch NASA's and NOAA's daily wind charts for the reversal around November 5. It only counts as a major warming once westerly winds return for 10 days in a row, which can take until late November or longer. Any effect on US weather would most likely show up in the weeks after. We will update this page after NOAA's updated November outlook (October 31), its next week 3 to 4 outlook (November 6), and once the wind has reversed or the forecast has failed.
Common questions
Is the polar vortex collapsing in November 2026?
Not yet. On October 29, the last measured day in NASA's data, the polar vortex winds were still blowing west to east at 30 mph. NASA's forecast has them reversing on November 5, and most models show at least a sharp drop. If they reverse, it will be the earliest major sudden stratospheric warming on record, about three weeks ahead of November 1968.
Will the polar vortex make it cold in the US?
Not on the evidence so far. NOAA's outlooks issued October 30 favor above-normal temperatures across most of the northern US through November 27, with equal odds in the Southeast and Southern Plains for November 14 to 27. In our check of 31 past events, the lower 48 was colder than normal in the following 30 days 18 times, about what chance would give. The second month leaned colder.
Which states could get colder?
In past events, the clearest pattern was in the second month after the reversal: the Northwest (Washington, Oregon, Idaho) and the West (California, Nevada) were colder than normal after 24 of 31. NOAA's current outlooks don't show that for late November, and in the first month no region stood out. Treat any state-by-state claim with care.
When would we feel it?
If there is any effect at the surface, it usually comes weeks later, not days. NOAA's week 3 to 4 outlook says the effects "often persist for up to two months." In February 2021, the South's coldest day came 42 days after the January 5 reversal. The reversal itself is forecast for around November 5.
What is a polar vortex split?
After a sudden stratospheric warming, the polar vortex usually either moves off the North Pole or splits into two smaller vortices, NOAA's Climate.gov explains. Severe Weather Europe expects a split this time. A split is a description of the shape high in the stratosphere. It doesn't tell you on its own where cold air will go at ground level.
Is this because of El Niño?
El Niño doesn't explain it. NOAA's winter outlook expected El Niño and the westerly QBO to keep the vortex more stable. But our count from NOAA's compendium finds 16 major warmings in 23 El Niño winters since 1958, against 10 in 20 neutral winters, so El Niño doesn't rule one out.
Does this mean a bad winter?
Not by itself. NOAA's winter outlook, issued October 15, favors above-normal temperatures for the northern tier and western third of the country from November through January, shaped by the strong El Niño. One early warming doesn't decide a whole winter, and NOAA updates its outlooks every month.
Sources (16)
- NASA GSFC: 60°N 10 hPa zonal-mean wind, 2026/27 (MERRA-2 and GEOS FP), read Oct 31, 2026
- NASA GSFC: daily 60°N 10 hPa wind files, 1978/79 to 2025/26
- NOAA CSL: Sudden Stratospheric Warming Compendium, table of major warmings (updated Sept 2023)
- NOAA NCEI: nClimGrid-daily area averages
- NOAA NCEI: US climate regions
- NOAA Climate Prediction Center: 6-10 and 8-14 day outlook discussion (Oct 30, 2026)
- NOAA Climate Prediction Center: week 3-4 outlook discussion (Oct 30, 2026)
- NOAA Climate Prediction Center: November 2026 outlook discussion (Oct 15, 2026)
- NOAA Climate Prediction Center: seasonal outlook discussion (Oct 15, 2026)
- NOAA Climate Prediction Center: sudden stratospheric warming monitoring (GFS and GEFS)
- NOAA Climate Prediction Center: Oceanic Niño Index
- NOAA Climate.gov: The polar vortex is hitting the brakes
- National Weather Service: The polar vortex
- CPSC: Keep warm and safe this winter: generators, furnaces and space heaters
- Ready.gov: Power outages
- CDC: Carbon monoxide poisoning basics
Get one calm email when it matters
Seasonal checklists and gear price drops. No spam, unsubscribe any time.
Keep reading
 Is a cold November ahead because the polar vortex is acting up early?A headline asks if an early polar vortex disruption means a cold November. NOAA's outlook favors a warmer nort…
 Winter storm preparedness checklist: before, during and afterA plain-English winter storm checklist: watch vs warning, home prep, supplies, staying warm, shoveling and car…
 Frozen pipes: how to prevent them and what to do if they freezeHow to keep pipes from freezing and what to do if they do: insulate, let faucets drip, thaw safely with a hair…
 How to stay warm without power in winter, safelyStay warm in a winter power outage safely: keep heat in, dress in layers, never heat with an oven or grill, kn…